What is Dashboard?
Dashboard is a performance monitoring library that creates and updates a website dynamically at runtime. Separate pages report the performance of key hardware and software components. The website may be viewed by any device supporting a web browser, including desktops, tablets and smartphones.To get an overview of the capabilities of Dashboard you may run MatrixWarrior.
How is Dashboard used?
| Your Application |
Your Application |
| FMSlib | |
| Dashboard | Dashboard |
| Operating System Hardware |
|
- Instrument your application with calls to Dashboard routines, or
- Use one of the FMSlib utilities already instrumented
with Dashboard. These utilities include:
- Matrix algebra,
- Parallel processing,
- GPU accelerators,
- Memory management, and
- Disk file striping.
What reports does Dashboard generate?
Website pages generated by Dashboard are divided into three categories:1. Hardware Reports:
Dashboard interfaces directly with hooks built into the operating system (Linux and Windows) to obtain configuration and performance information. Dashboard also uses functions provided by hardware manufacturers to obtain device-specific information. These reports are initialized by a single call at the beginning of your application. As your application is running, time varying information is automatically updated at a specified interval.2. Application Reports:
Dashboard also provides functions which monitor the performance of your application. These include calls you can make at the beginning and end of subroutines. Dashboard uses the information you provide to maintain a call stack, listing the currently active routines and the order in which they were called. A call history is also maintained, which lists the number of times each routine was called, the calling thread (parent or child) and the time used (CPU and Wall).You may also provide Dashboard with the amount of Useful Work the routine is performing. Typical Useful Work items include floating point operations performed or bytes transferred. Dashboard combines this information with the routine timing to compute the rate of performing useful work. This information is then displayed as compute rate (flops/sec) or transfer rate (bytes/sec).
3. Custom Reports:
Dashboard can also generate application-specific pages to display information in the context of an application. As an example, FMSlib includes a Performance page which provides job status and a summary of compute and transfer rates. This page also includes a picture of the matrices and vectors being processed.If your application uses FMSlib, Dashboard is already included. As an option, you can supplement the FMSlib reports by including calls to your routines.
Where do I get Dashboard?
Dashboard is distributed as part of the FMSlib library. You may obtain Dashboard by downloading FMSlib from Multipath's website at www.fmslib.com.Installing Dashboard in your application
The first step is to add a nonzero value of IWATCH to the license file between theFMSSET
and RETURN lines as follows:
FMSSET
IWATCH=99
RETURN
This will instruct the FMS library to generate Dashboard reports. If FMSlib is already installed in your application, this is all that is required.
1. Hardware Reports
To generate reports on the installed hardware and its performance, make the following two calls in your application:
CALL FMSINI()
During this call, Dashboard performs a series of initialization steps.
A list of these steps is included in the subroutine description for
FMSINI.
This call should be at the beginning of your application so the overall timing reports
will be accurate.
Next,
CALL FMSEND()
The call to
FMSEND
should be at the end of your application.
These two calls are all that is required to generate the Dashboard hardware reports. If you are using FMSlib, these calls are already in your application.
2. Application Reports
You can instrument your application to provide performance and timing reports by placing your routines on the Dashboard call stack as follows:
       SUBROUTINE MYSUB(...)
       CALL FMSPSH("MYSUB")
       ...
       CALL FMSPOP("MYSUB")
       END
The first call places the subroutine on the stack and the second call removes it.
Dashboard creates a time stamp on both calls to compute
the net timing (CPU, WALL) spent in the routine.
You may instrument all or part of your application. Subroutines can be nested.
Dashboard also records which thread made the call, parent
or child.
The first call to FMSPSH is assumed to be your application name. This name is included on the header of each page.
3. Custom Reports
All timing data collected by Dashboard is available to generate an application-specific web page. As an example, the Performance page was designed to display information important to FMSlib. If you have an application that could benefit from a custom Dashboard page, please contact Multipath for more information.How Dashboard works
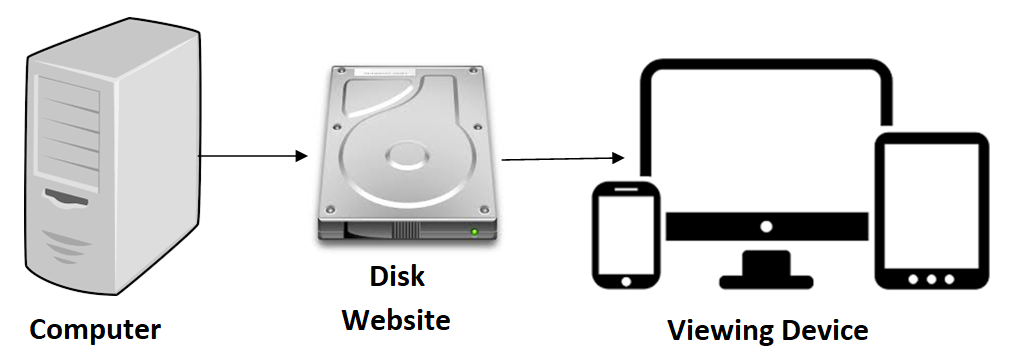 The display of information involves the following 3 steps:
- Dashboard and the instrumented application run on a computer. This is the machine and application that are monitored. It can be any machine running the Linux or Windows operating system, from a laptop to high performance server containing GPU accelerators.
- Dashboard creates a website as files on a disk. This disk may be in the instrumented computer or on any remote fileserver accessible from the instrumented computer. By default, webpages are stored in the current working directory used to run the application. You may change this location by specifying the directory in the environment variable FMSHTML.
- You view the website from any viewing device that contains a web browser, including a pc, tablet or smartphone.
How to control Dashboard reports
| Parameter | Default | Description |
|---|---|---|
| IWATCH | 0 | Which reports are generated A value of 115 will generate a movie. |
| NSUPD | 5 sec. | How frequently Dashboard updates the pages |
| NSREF | 3 sec. | How frequently the browser reloads the pages |
| NSMOVE | 2 sec. | The pause between movie frames |
| MAXMOV | 1000 frames | Maximum number of movie frames |
- IWATCH determines what reports are generated. Several separate options are available, including making a movie of the Performance page. To enable report generation, set the FMS Parameter IWATCH to a nonzero value.
- NSUPD determines when pages are updated. For most applications it may not be necessary to generate new pages for all intermediate results. Dashboard records when the contents of a page have changed. When NSUPD seconds have elapsed since the last update, and the page has changed, a new version is generated. Increasing NSUPD will reduce the number of intermediate pages. In all cases, the first and last pages are generated.
- NSREF determines how often your browser reloads pages. You may force a reload at any time by clicking on the Reload page tab or typing control-r.
- NSMOVE determines interval between movie frames.
- MAXMOV is the maximum number of movie frames to generate. FMS divides data into blocks which fit in memory. A separate movie frame is generated as each block is processed. When a large problem stored on disk is run on a machine with a small amount of memory, the number of operations on the blocks may become very large. Under these contitions this Parameter prevents an excessive number of movie frame files from being generated.
Dashboard Reports
The pages displayed by Dashboard depend on what functions have been implemented and what hardware is available. This section presents the results of implementing Dashboard in FMSlib.Main
This page lists the network node name of the machine.You can include the name of your application in one of two ways:
- Explicitly setting it,
CALL FMSCST(ANAME, 'My_Application')
or - Dashboard will use the name of the first routine put
on the stack:
CALL FMSPSH('My_Application')
CPUs
This page lists the number and type of CPUs installed in the system. Note that for modern processors, the Clock Speed listed may change with utilization.GPU-Fixed
This page lists information about the GPUs that does not change during the run. If multiple GPUs of different types are found, only the one(s) with the highest compute capability are listed. If no GPUs are available, pages GPU1 and GPU2 are not generated.Nvidia uses two numbering systems: one by the Run Time Library (RTL) and another by the Nvidia Management Library (NVML). These may not be the same and can change on reboot. Correlation between these numbering systems is established by the PCI bus location of the device. This page lists the devices in the RTL order and shows the corresponding NVML number for reference. If you use the nvidia-smi utility to change the properties of a device, you should use the NVLM number.
Dashboard needs to know where the Nvidia NVML utilities are located in your file system. By default, the following directories are used:
   (Linux)   /usr/bin
   (Windows) "C:\Program Files\NVIDIA Corporation\NVSMI"
The nvidia-smi utility is also in this directory. If this utility is in a different directory, then the FMS Parameter CUPATH must be included in the license file to provide the name of this directory. If Dashboard cannot find this directory, the application will still run but some of the hardware information about the GPUs will be missing.
GPU-Chg.
This page lists GPU information which may be changed, either by the application program or using the nvidia-smi utility. This includes limits on temperature, power and clock speed.GPU-Dyn.
This page lists GPU information that changes with time. This includes temperature, fan speed (for workstations), utilization rates, ECC errors and power management. This page is automatically updated during the run.GPU-RTL
This page lists GPU information from the Run Time Libaray. This may include some of the information obtained from NVML, where available.Memory
This page lists the total amount of memory in the system. For applications which use the FMS Memory Management utilities, it also shows how that memory is allocated. On systems with GPUs, it lists the memory for each GPU and its address range.Disks
This page lists the following tables:- Disk Properties by Mount Point (Linux) or Drive Letter (Windows)
This table provides useful information on the disks that are available for storing data. - Disks used by FMS
For applications which use the FMS file system, this table lists information for each file stripe, including the space used and available, number of accesses, average transfer size and transfer rate. - Disk Performance by File Type
This table lists the overall performance of the disks for each type of file used by FMS. - Overall Disk Performance
This table provides a summary of disk performance for synchronous and asynchronous transfers for both read and write operations.
Files
For applications using the FMS File Striping System, information on open FMS files, their stripe configuration and performance are listed.Software
This page lists the following information about the software being used by the application and FMS:- Program File Name
The name of the file for the current running program. - Files Used
This list includes shared-object files used by the application that were referenced when the application was linked. - Software
Where appropriate, this table lists the version number of the FMS library, Intel and Nvidia libraries and Fortran and C compilers. - Environment Variables
This table lists the environment variables which are defined.
Calls
This page lists the subroutines which have been called. The order in each table is determined by the order of first call. The following tables are included:- Application Subroutines
Subroutines that you have instrumented with calls to FMSPSH and FMSPOP. - FMS Main Subroutines
FMS subroutines called directly by your application. - FMS Callback Subroutines
Subroutines you provided to define matrix data or special processing of diagonal pivots. - FMS Internal Subroutines
Subroutines called internally by FMS to measure the performance of specific utilities. - FMS GPU Subroutines
Kernel subroutines run on the GPUs. - Dashboard subroutines used to generate the WEB site
Parameters
This page lists the current values of FMS parameters which have been changed from default values. In some cases, changing one parameter will cause others to be changed also. Some of the parameters are output only and are computed by FMS.When FMS determines that a different value of a Parameter would improve performance, they are listed in the Suggested Tuning Values table.
Performance
This is the application-specific page for monitoring FMS performance. It first lists the FMS routine currently executing with a link to its manual page and the total wall time used. All information on this page pertains to that routine. When a new routine is called, this page is reset.This page contains one or more of the following sections:
- Status Bar
The first bar shows the percent completion for the current routine, based on the total number of operations required and the number completed. The second bar shows the percent contribution of major tasks, based on the amount of wall time used. - Times and Problem
This section lists information about the current running job, including times, problem type and size, and performance of processors and disks. It includes an estimate of when the routine will complete, based on work to be performed and the current performance. - Overall Performance
This is the bottom line number. It lists the overall performance of all processors, not including any time spent waiting for I/O. The units are floating point operations per second. The heading changes as the performance increases. - Component Performance
This lists the individual performance of major subroutines and the contribution made by the group of CPUs and each of the GPUs. Performance of the individual hardware components is based on the amount work performed and the wall time used. Overall performance of the routine is based on the total amount of work done by all hardware components and the total wall time used. The total performance of a routine will always be less than the sum of the individual components, due to load balancing. This section also lists the model of the GPUs, if appropriate. - Matrix Picture
Where appropriate, a picture of the matrix and vector(s) are shown as they are blocked for processing. The status of each block changes as the computation proceeds. The area currently being updated is shown in red, the data being referenced is shown in light red and other colors are used to show the state of the data. When the computation is complete, this picture is removed. - Time Table
This section lists the time (sec) used by each of the components for each of the major routines. In a perfectly balanced system, each component would use the same amount of time. For systems with several powerful GPUs, the CPUs are often not used for computation.This table also lists other times, including the time Dashboard spends generating the WEB reports.